Developing WARDuino
This guide is for people who want to help with development. We highly recommend you first read more on the architecture of the virtual machine in the technical reference.
A Tale of three Versions
For microcontrollers, WARDuino supports two different toolchains, Arduino and ESP-IDF. Additionally, there is a third version to run on desktops with its own command-line interface.
Each version of the virtual machine has a slightly different way of receiving debugging messages, has a different entry point, and has their own primitive implementations. Each version has its own folder under platforms in the git repository. The implementations of the primitives for each platform are found in the src/Primitives folder.
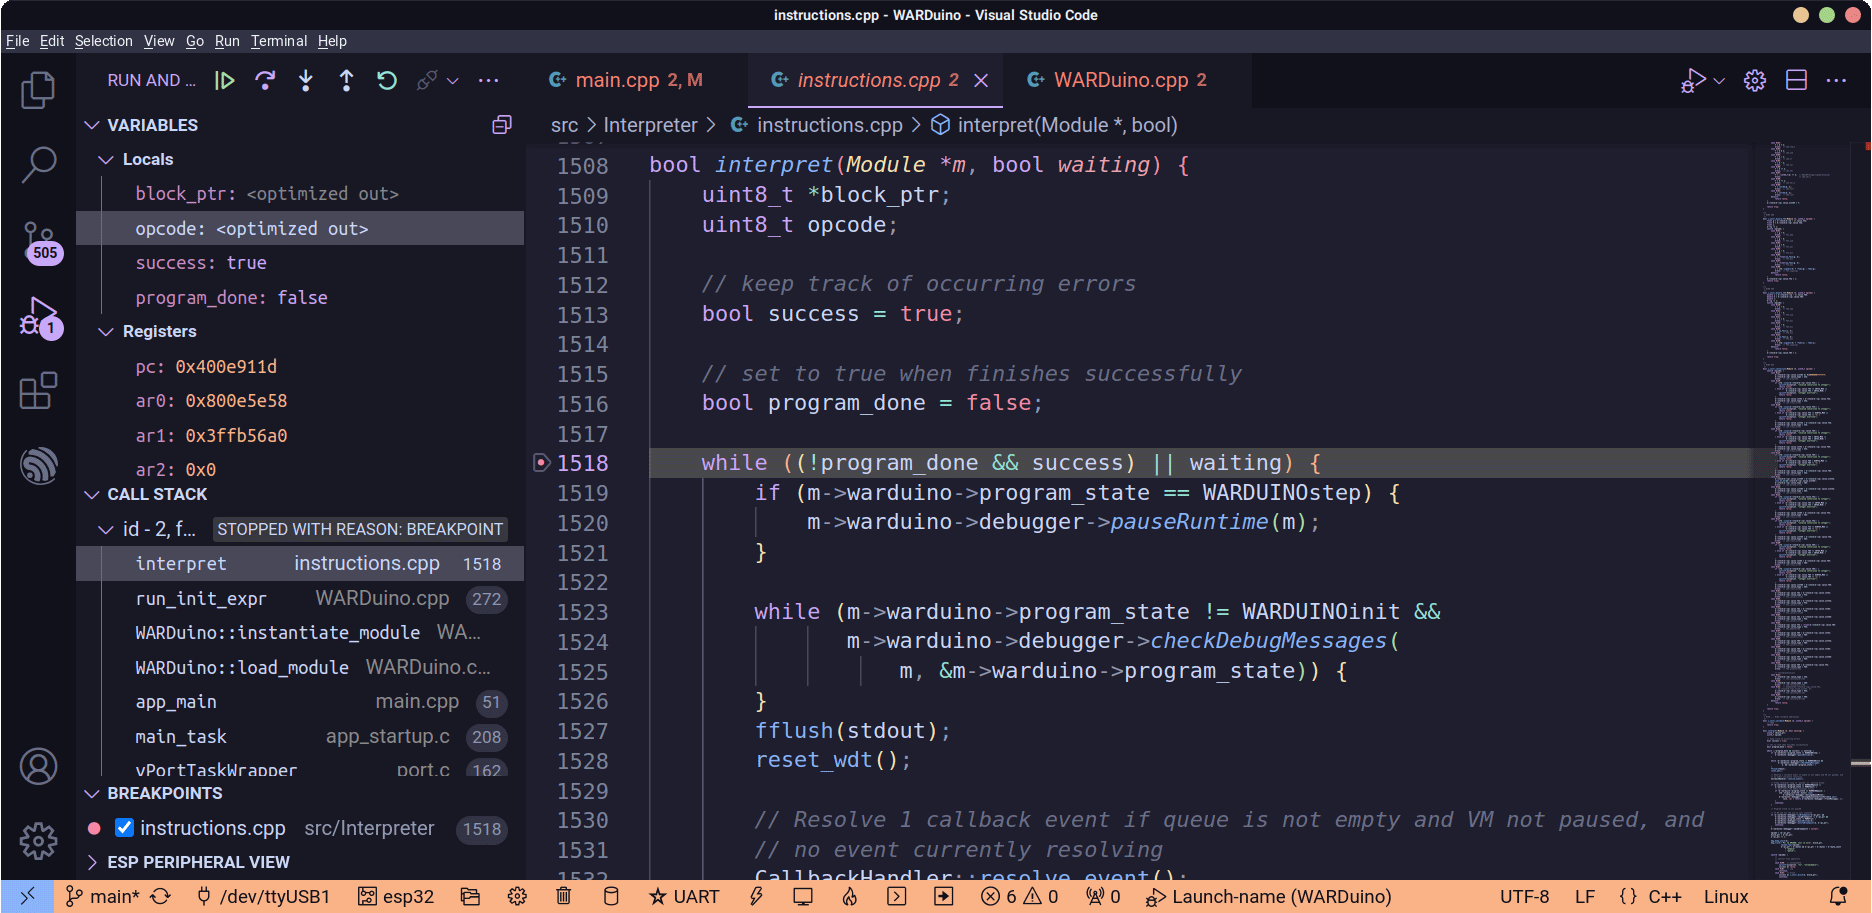
Debugging the Virtual Machine
While the WARDuino debugger allows developers to debug their programs on the microcontroller, the VM itself also needs to be debugged from time to time. That includes the debugger of the VM as well. Luckily the debugger can be debugged with the help of a JTAG interface.
This tutorial goes over the steps you can take to debug the WARDuino virtual machine with the ESP32 WROVER KIT v4.1, but other boards and JTAGs can also be used.
Debugging the Arduino version
This tutorial uses OpenOCD to debug the ESP-IDF version of WARDuino. The Arduino version can be debugged using the new Arduino IDE 2.
ESP32 WROVER KIT V4.1 Tutorial
The ESP32 WROVER KIT v4.1 has been extensively used to debug and develop the WARDuino virtual machine. It comes standard with a JTAG to USB interface, which makes debugging fairly easy to setup—as JTAGs go.
First Time Setup
Step 1. Before you start, you need to enable the JTAG interface by installing the right jumper blocks on the board.
Step 2. You need to install OpenOCD.
Step 3. You need to install the ESP-IDF toolchain.
Step 4. In order to connect to the ESP32 device with OpenOCD you need to run[1]:
openocd -f board/esp32-wrover-kit-3.3v.cfgPermission problems
If you encounter an error, LIBUSB_ERROR_ACCESS, then this is mostly likely due to OpenOCD lacking the right permissions to access the serial port.
Development Environment Setup
These steps are meant for debugging the WARDuino virtual machine, but can be used to debug other projects as well. If you first want to try out the debugger on an example project, we recommend the IDF LCD example:
cp -r $IDF_PATH/examples/peripherals/spi_master/lcd .
cd lcd
Step 1. In the project root folder, add the "wrover kit" component:
idf.py add-dependency "espressif/esp_wrover_kit^1.5.0"If you use a different board and JTAG this step will be different.
Step 2. To use the gdb command-line interface, add a gdbinit file to the project root folder[2] with:
target remote :3333
set remote hardware-watchpoint-limit 2
mon reset halt
maintenance flush register-cache
thb app_main
c
Step 3. Now you need to build and flash:
idf.py build
idf.py flash
That concludes the setup. Now you are finally ready to start debugging.
Debugging with gdb. You can use idf.py to start both OpenOCD and gdb:
idf.py openocd &
idf.py gdb
Debugging with VS Code. Espressif has also developed a VS Code plugin to use OpenOCD debugging.